- Share
- Share on Facebook
- Share on LinkedIn
The knowledge of the absorption spectrum of water vapor (70% of the atmospheric greenhouse effect!) is currently insufficient to accurately account for the absorption of sunlight by our atmosphere and its impact on the measurement of some minority atmospheric components. Our contribution contributes to the improvement of the knowledge of water vapor absorption by measuring weak transitions and continuum (self continuum and foreign continuum). It is part of a project supported by INSU via the program LEFE - Atmospheric Chemistry, project and within the Associated International Laboratory (LIA) SAMIA with the partners of the IAO in Tomsk (Russia).
Rovibrational transitions and database
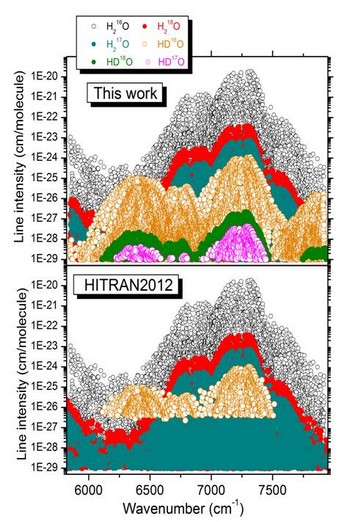
The CW-CRDS technique allowed us to extensively study (position, intensity, and assignment) the main water vapor isotopologue, H216O, and five minority isotopologues (Fig. 1), representing 38,300 transitions between 5850 and 7920 cm-1. These transitions could be assigned in collaboration with S. Mikhailenko [DOI: 10.1016/J.JQSRT.2014.02.006] (Laboratory of Theoretical Spectroscopy, V.E. Zuev Institute of Atmospheric Optics, Tomsk, Russia) as part of the LIA SAMIA. Compared to existing FTS data, a gain in detectivity of two to three orders of magnitude has been obtained, which represents a decisive contribution to the characterization of atmospheric transparency windows (at 1.5 µm and 1.25 µm for example - Fig. 1). Progress has been particularly marked for minority isotopologues, notably HDO. Our comprehensive empirical list is now included in the latest version of the GEISA database and has been selected for inclusion in the next update of HITRAN.
The water vapor continuum
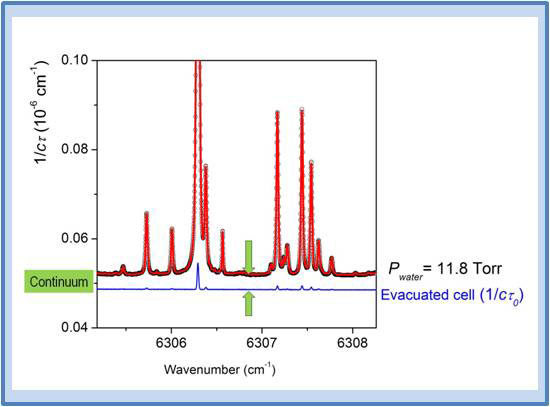
The definition of the water vapor continuum as shown in Fig.2 is somewhat arbitrary: it is the difference between the "true" measured absorption and that due to local monomer lines calculated using, for each of the transitions, a specific line profile (typically Voigt ) over an interval Δσc on either side of the line center (typically Δσc= 25 cm-1). The continuum value thus obtained is therefore related to the absorption line database used and the choice of line profile modeling of the monomer.
The water vapor continuum plays an important role in the calculation of the energy balance of the Earth's atmosphere. On the other hand, its spectral extent makes its characterization necessary during the remote sensing of geophysical elements with extended optical signatures such as surface albedos, aerosols and clouds.
The continuum has a quadratic dependence with density and its effective cross section decreases with increasing temperature.
The origin of the water vapor continuum has been subject to debate for several decades [DOI: 10.1007/s10712-011-9170-y]. Several "physical phenomena" are likely to explain it. These are:
- the absorption of the wings of the allowed lines of the monomer (at more than Δσc from the line centers),
- the absorption of stable or metastable dimers (H2O-H2O, H2O–N2, H2O-O2,...),
- collision induced absorption.
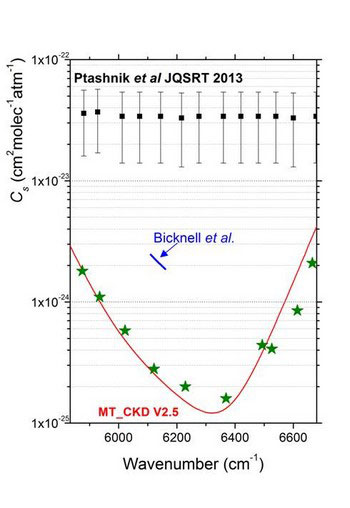
Due to many experimental difficulties measurements of the water vapor continuum cross section in the near infrared are limited in number and provide scattered values sometimes in great disagreement with model results [DOI: 10.1029/2011JD015603] (Fig. 2). These disagreements illustrate the need for accurate measurements of water vapor continuum cross sections in this spectral range.
We have measured, for the first time by CRDS, the effective cross section of the "self-continuum" between 5875 and 6665 cm-1[DOI: 10.1002/2013JD021319]. These measurements were performed between room temperature and 340 K which allowed us to also determine the temperature dependence of the effective cross section for the different spectral points studied. The very high sensitivity and stability of our CRDS spectrometer allowed us to determine this effective cross section with a much better uncertainty compared to previous measurements. As shown in Fig. 3, our measurements are not far from the values provided by the MT_CKD V2.5 model but disagree by a factor of 80 (!!) with the FTS measurements obtained very recently. The origin of the disagreement between our CRDS measurements and the FTS measurements has not yet been identified despite numerous investigations, but could result from the lack of sensitivity of the latter.
Our publications on the subject
Actors
Alain CAMPARGUE
Samir KASSI
Didier Mondelain
- Share
- Share on Facebook
- Share on LinkedIn