- Share
- Share on Facebook
- Share on LinkedIn
Insufficient knowledge of the spectrum of methane (CH4) at low temperature has long been a major limitation to the analysis of spectral data of some planets. On the basis of laboratory spectra obtained by ultra sensitive laser techniques, the LAME team has recently succeeded in constructing two lists of absorption lines for methane at 80 K and 296 K in the range 1.26-1.71 µm.
The WKLMC list (Wang Kassi, Leshchishina, Mondelain and Campargue) allows to simulate the spectrum of methane between 80 K and 300 K. The 80 K list has become the reference list for planetological applications. It has already been successfully applied to the atmospheres of Titan, Pluto, Uranus, Saturn and Jupiter. The 296 K list is now integrated to the HITRAN spectroscopic database which is the reference for atmospheric applications.
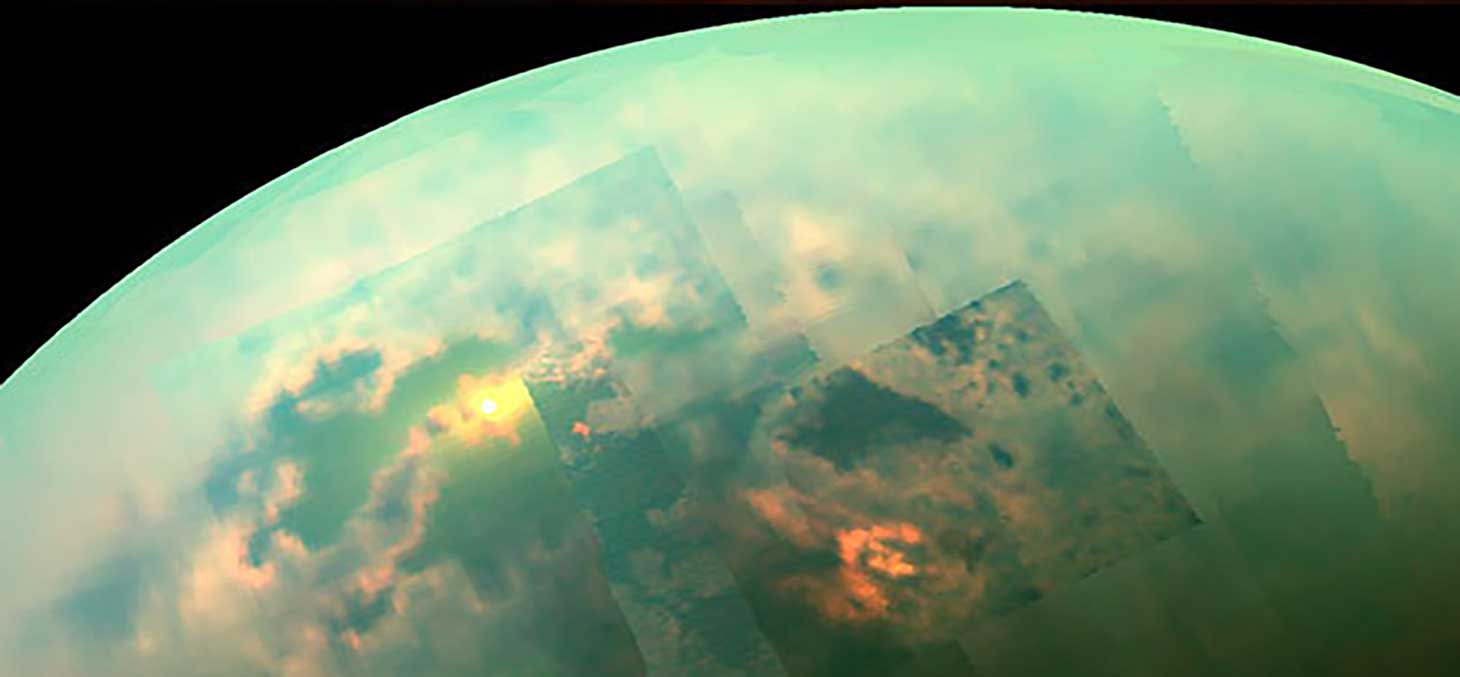
Within the framework of a funding from the French National Research Agency (ANR CH4 @ Titan), we collaborate with planetary scientists from LESIA (UMR CNRS - Paris Observatory) involved in the Cassini-Huygens mission to study Saturn and Titan. Methane is an important constituent of the atmosphere of Titan and of the giant planets (Saturn, Jupiter,...) and is one of the main absorbers of the infrared spectrum of these atmospheres. For example, the atmosphere of Titan consists of 2-5% methane in nitrogen at a pressure of 1.5 bar and at temperatures from T= 70-115 K in the troposphere to 180-200 K in the stratosphere.
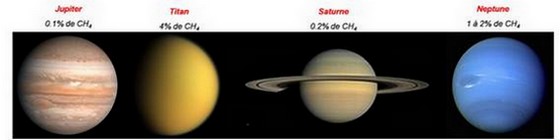
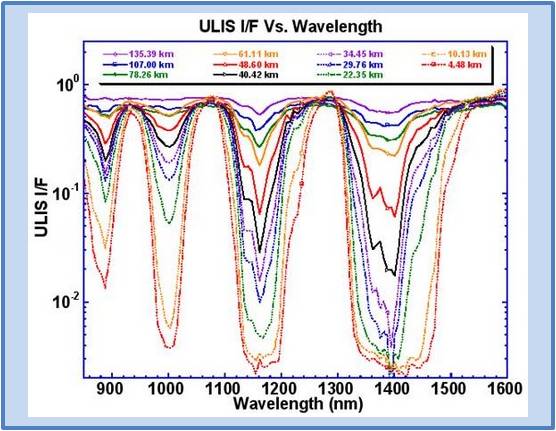
In the absence of a satisfactory theoretical model for the methane spectrum, accurate and comprehensive low-temperature experimental data are essential to study these atmospheres. Thus, the transparency windows, corresponding to the regions of weak absorption between the strong methane absorption bands (Fig. 1), give access to the composition of the lower atmosphere and the surface albedo of these planets.
We have therefore studied the spectrum of methane in the laboratory at high spectral resolution between 1.21 and 1.72 µm both at room temperature and at 80 K (-190 °C), using a cryogenic cell cooled with liquid nitrogen. For this we used the CRDS (Cavity Ring down Spectroscopy) technique, in the transparency windows at 1.58 and 1.28 µm and the differential absorption technique in the strong absorption ranges.
WKLMC line lists at 296 K and 80 K
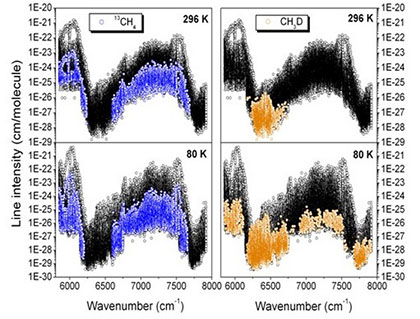
From the different recorded spectra we were able to construct two line lists, one at 296 K and the other at 80 K (WKLMC lists)[1] which each contain more than 50 000 transitions for the whole region (5852-7920 cm-1) (Fig. 2).
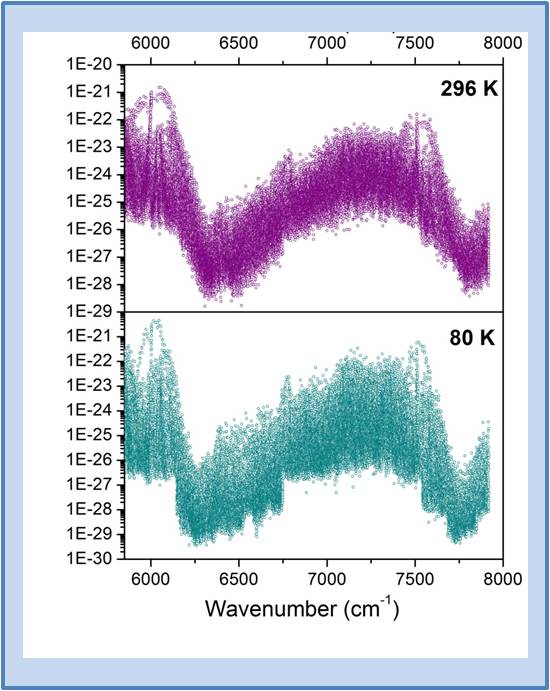
These lists include, for each transition, the position, intensity and energy of the lower level of the transition from the measurement of the transition intensity at two temperatures (296 and 80 K), which allows extrapolation of the intensity to any intermediate temperature. We also performed, for most of the transitions, the identification of the isotopologue to which it belongs. This identification was performed by complementary measurements by differential absorption spectroscopy with methane enriched in 13CH4 and CH3D.
An unexpected result was the demonstration that CH3D is the dominant absorber at 80 K in the window at 1.58 µm, and this despite its very low concentration (5.0x10⁻⁴) (Fig. 3). This identification work is crucial for CH3D whose relative abundance (and thus the transparency of the window at 1.58 µm) varies enormously depending on the planetary object studied (for example a factor 6 for Jupiter).
Applications of WKMC lists: the case of Titan (in collaboration with LESIA-Meudon)
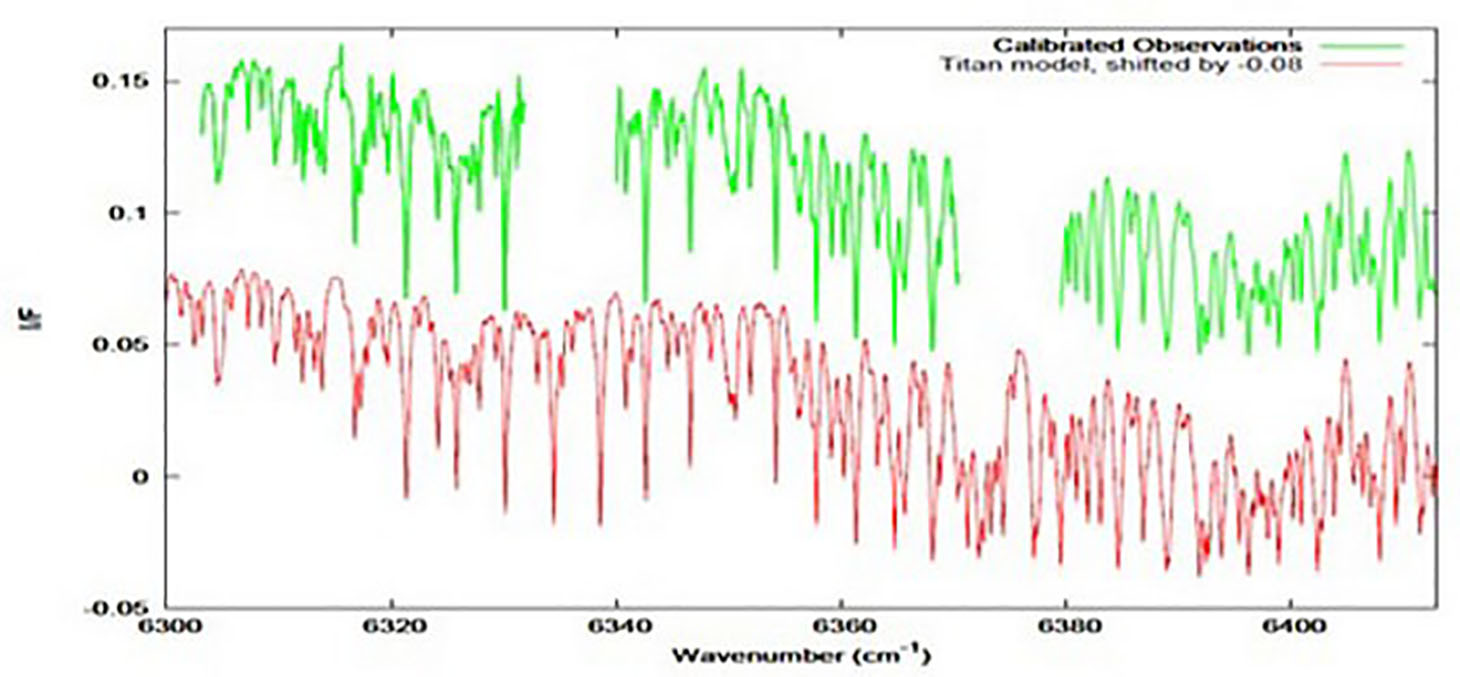
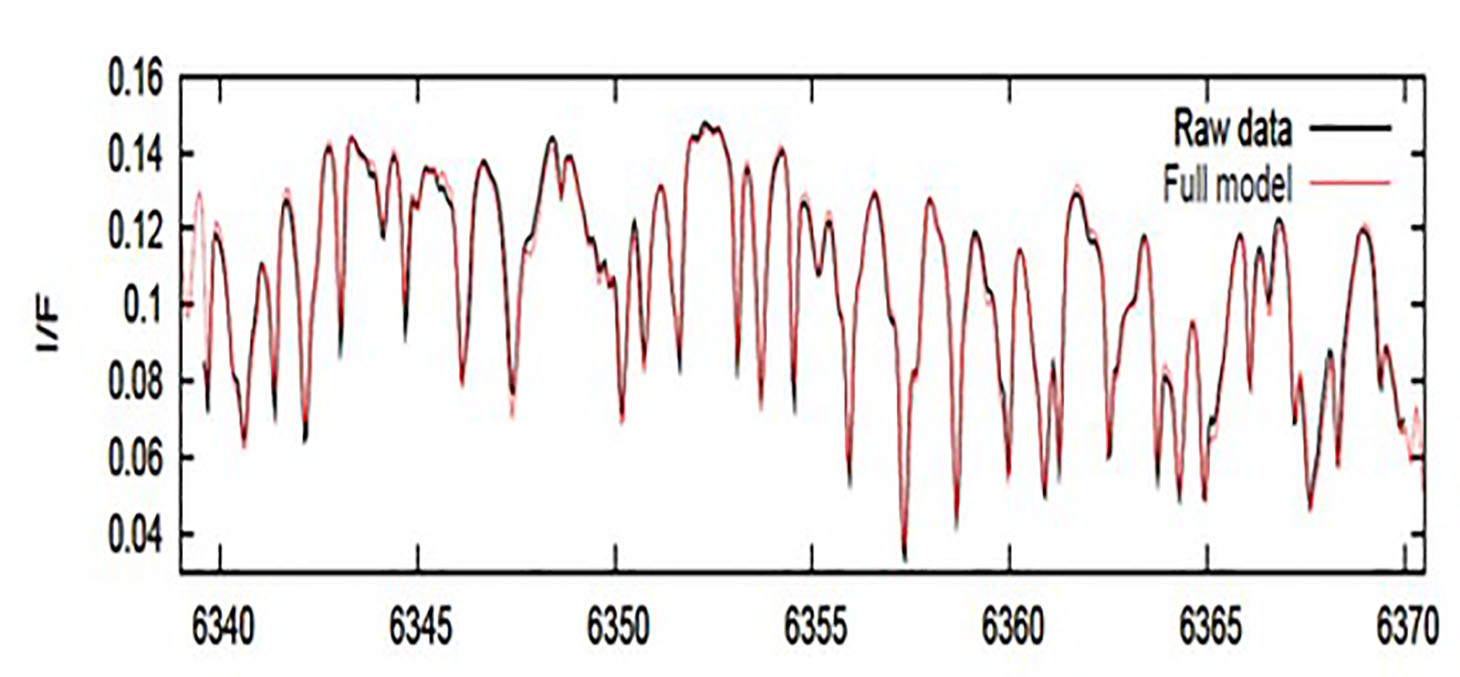
The WKLMC list at 80 K has become the reference list for applications in planetology. It has already been successfully used to analyze the spectra of Titan, Uranus, Pluto, Saturn and Jupiter. Using our line lists, the methane spectrum could be simulated for Titan's atmosphere and compared with the one recorded at high resolution from Earth with the CRIRES instrument [2]. Figure 4 shows the very good agreement obtained between the experimental spectrum and the simulation.
References
[1] A. Campargue, O. Leshchishina, L. Wang, D. Mondelain, S. Kassi, "The WKLMC empirical line lists (5852-7919 cm‑1) for methane between 80 K and 296 K: "Final" lists for atmospheric and planetary applications", Journal of Molecular Spectroscopy, Elsevier, 2013, 291, pp.16-22. ⟨10.1016/J.JMS.2013.03.001⟩
[2] Alain Campargue, Le Wang, Didier Mondelain, Samir Kassi, Bruno Bézard, Emmanuel Lellouch, Athena Coustenis, Catherine De Bergh, Mathieu Hirtzig, Pierre Drossart, "An empirical line list for methane in the 1.26-1.71 μm region for planetary investigations (T = 80-300 K). Application to Titan", Icarus, Elsevier, 2012, 219, pp.110-128. ⟨10.1016/J.ICARUS.2012.02.015⟩
Actors
Alain CAMPARGUE
Samir KASSI
Didier MONDELAIN
- Share
- Share on Facebook
- Share on LinkedIn