- Share
- Share on Facebook
- Share on X
- Share on LinkedIn
Publication / Research
On June 20, 2022

The migration of cells in 3D media is a complex process and plays a key role in the development of cancers. During metastasis, cancer cells develop a strategy and a mode of migration adapted to their environment to invade other tissues. In this study, we analyzed the migration of cancer cells with different metastatic potentials in various collagen matrices.
The migration of cells in 3D media is a complex process and plays a key role in the development of cancers. During metastasis, cancer cells develop a strategy and a mode of migration adapted to their environment to invade other tissues.
In this study, we analyzed the migration of cancer cells with different metastatic potentials in various collagen matrices. The collagen fibers and the cell actin cytoskeleton were visualized simultaneously using the reflection and fluorescence imaging modes on a confocal microscope. The displacement fields of collagen fibers were determined using a home–made phase correlation algorithm applied to the reflection image stacks obtained in time. The analysis of the cell shape in parallel with the collagen fiber displacement showed the most invasive cells are characterized by a great diversity of shape. These cells produced the largest fiber displacements whatever the rigidity of the collagen gel. The detailed analysis of cell movements enhanced the fact that cancer cells were also able to exhibit different phenotypes (mesenchymal and amoeboid) according to their metastatic potential. We showed that cells can push and/or pull collagen fibers in order to deform collagen efficiently. The actin–rich regions were found to be correlated with the largest displacement fields and the correlation is enhanced in the case of most invasive cells.

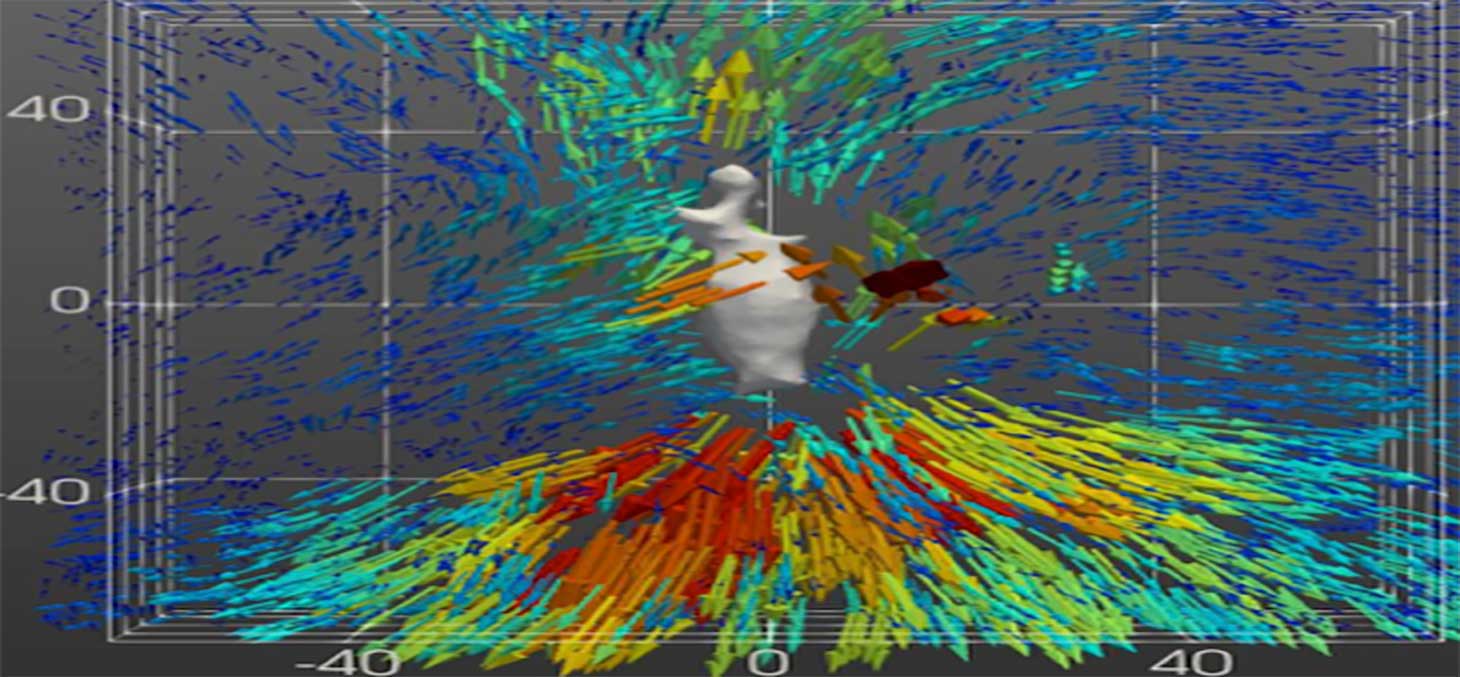
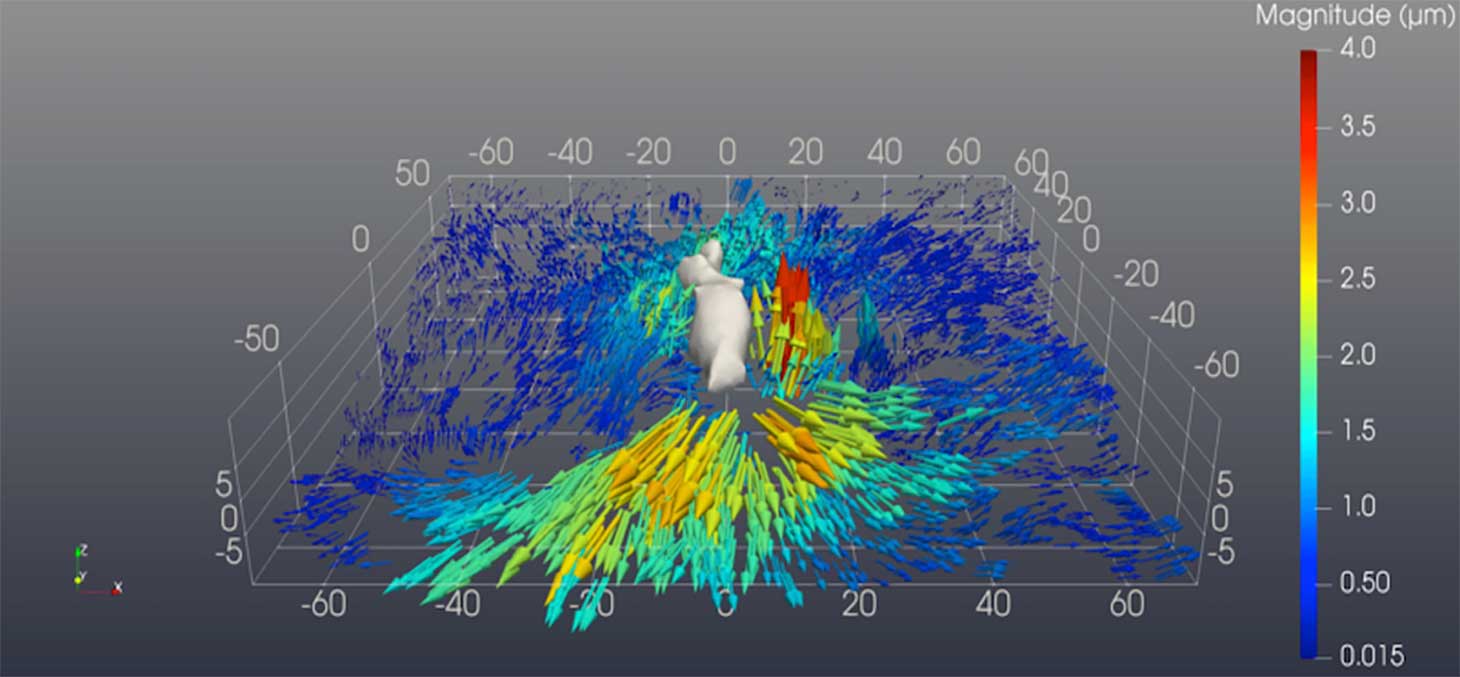
Figure : 3D collagen fiber displacements around a migrating bladder cancer cell. The initial 3D cell shape is shown in grey. The vector length and the color indicate the displacement magnitude in µm. The x, y and z grids are in µm.
Date
- Share
- Share on Facebook
- Share on X
- Share on LinkedIn